Observability
RIOT-X exposes several metrics over a Prometheus endpoint that can be useful for troubleshooting and performance tuning.
Getting Started
The riotx-dist repository includes a Docker compose configuration that set ups Prometheus and Grafana.
git clone https://github.com/redis/riotx-dist.git
cd riotx-dist
docker compose up
Prometheus is configured to scrape the host every second.
You can access the Grafana dashboard at localhost:3000.
Now start RIOT-X with the following command:
riotx replicate ... --metricsThis will enable the Prometheus metrics exporter endpoint and will populate the Grafana dashboard.
Configuration
Use the --metrics* options to enable and configure metrics:
--metrics-
Enable metrics
--metrics-jvm-
Enable JVM and system metrics
--metrics-redis-
Enable command latency metrics. See https://github.com/redis/lettuce/wiki/Command-Latency-Metrics#micrometer
--metrics-name=<name>-
Application name tag that will be applied to all metrics
--metrics-port=<int>-
Port that Prometheus HTTP server should listen on (default:
8080) --metrics-prop=<k=v>-
Additional properties to pass to the Prometheus client. See https://prometheus.github.io/client_java/config/config/
Metrics
Below you can find a list of all metrics declared by RIOT-X.
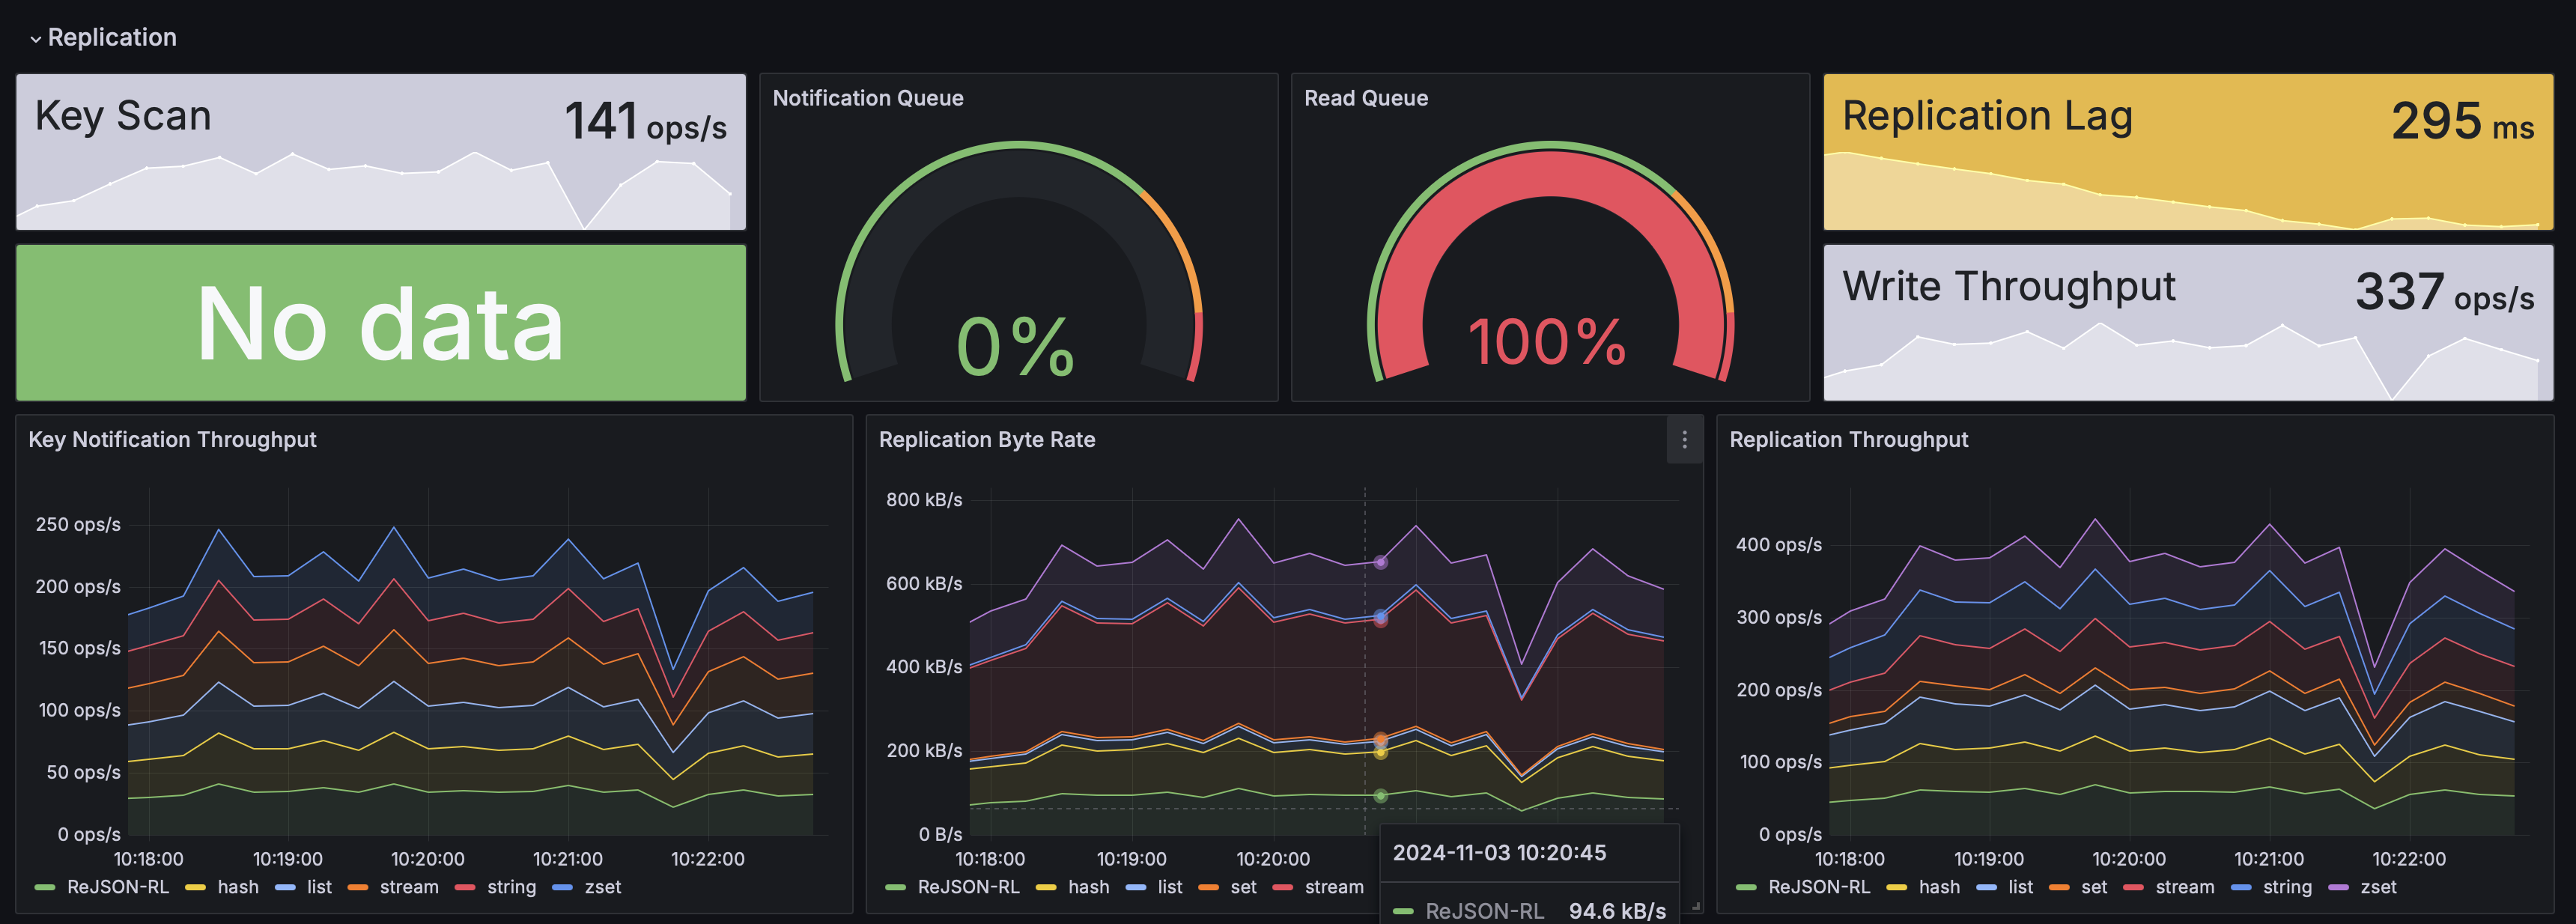
Replication Metrics
| Name | Type | Description |
|---|---|---|
|
Counter |
Number of bytes replicated (needs memory usage with |
|
Summary |
Replication end-to-end latency |
|
Summary |
Replication read latency |
|
Timer |
Batch writing duration |
|
Timer |
Item processing duration |
|
Timer |
Item reading duration |
|
Timer |
Active jobs |
|
Counter |
Job launch count |
|
Gauge |
Gauge reflecting the remaining capacity of the queue |
|
Gauge |
Gauge reflecting the size (depth) of the queue |
|
Counter |
Number of keys scanned |
|
Timer |
Operation execution duration |
|
Gauge |
Gauge reflecting the chunk size of the reader |
|
Gauge |
Gauge reflecting the remaining capacity of the queue |
|
Gauge |
Gauge reflecting the size (depth) of the queue |
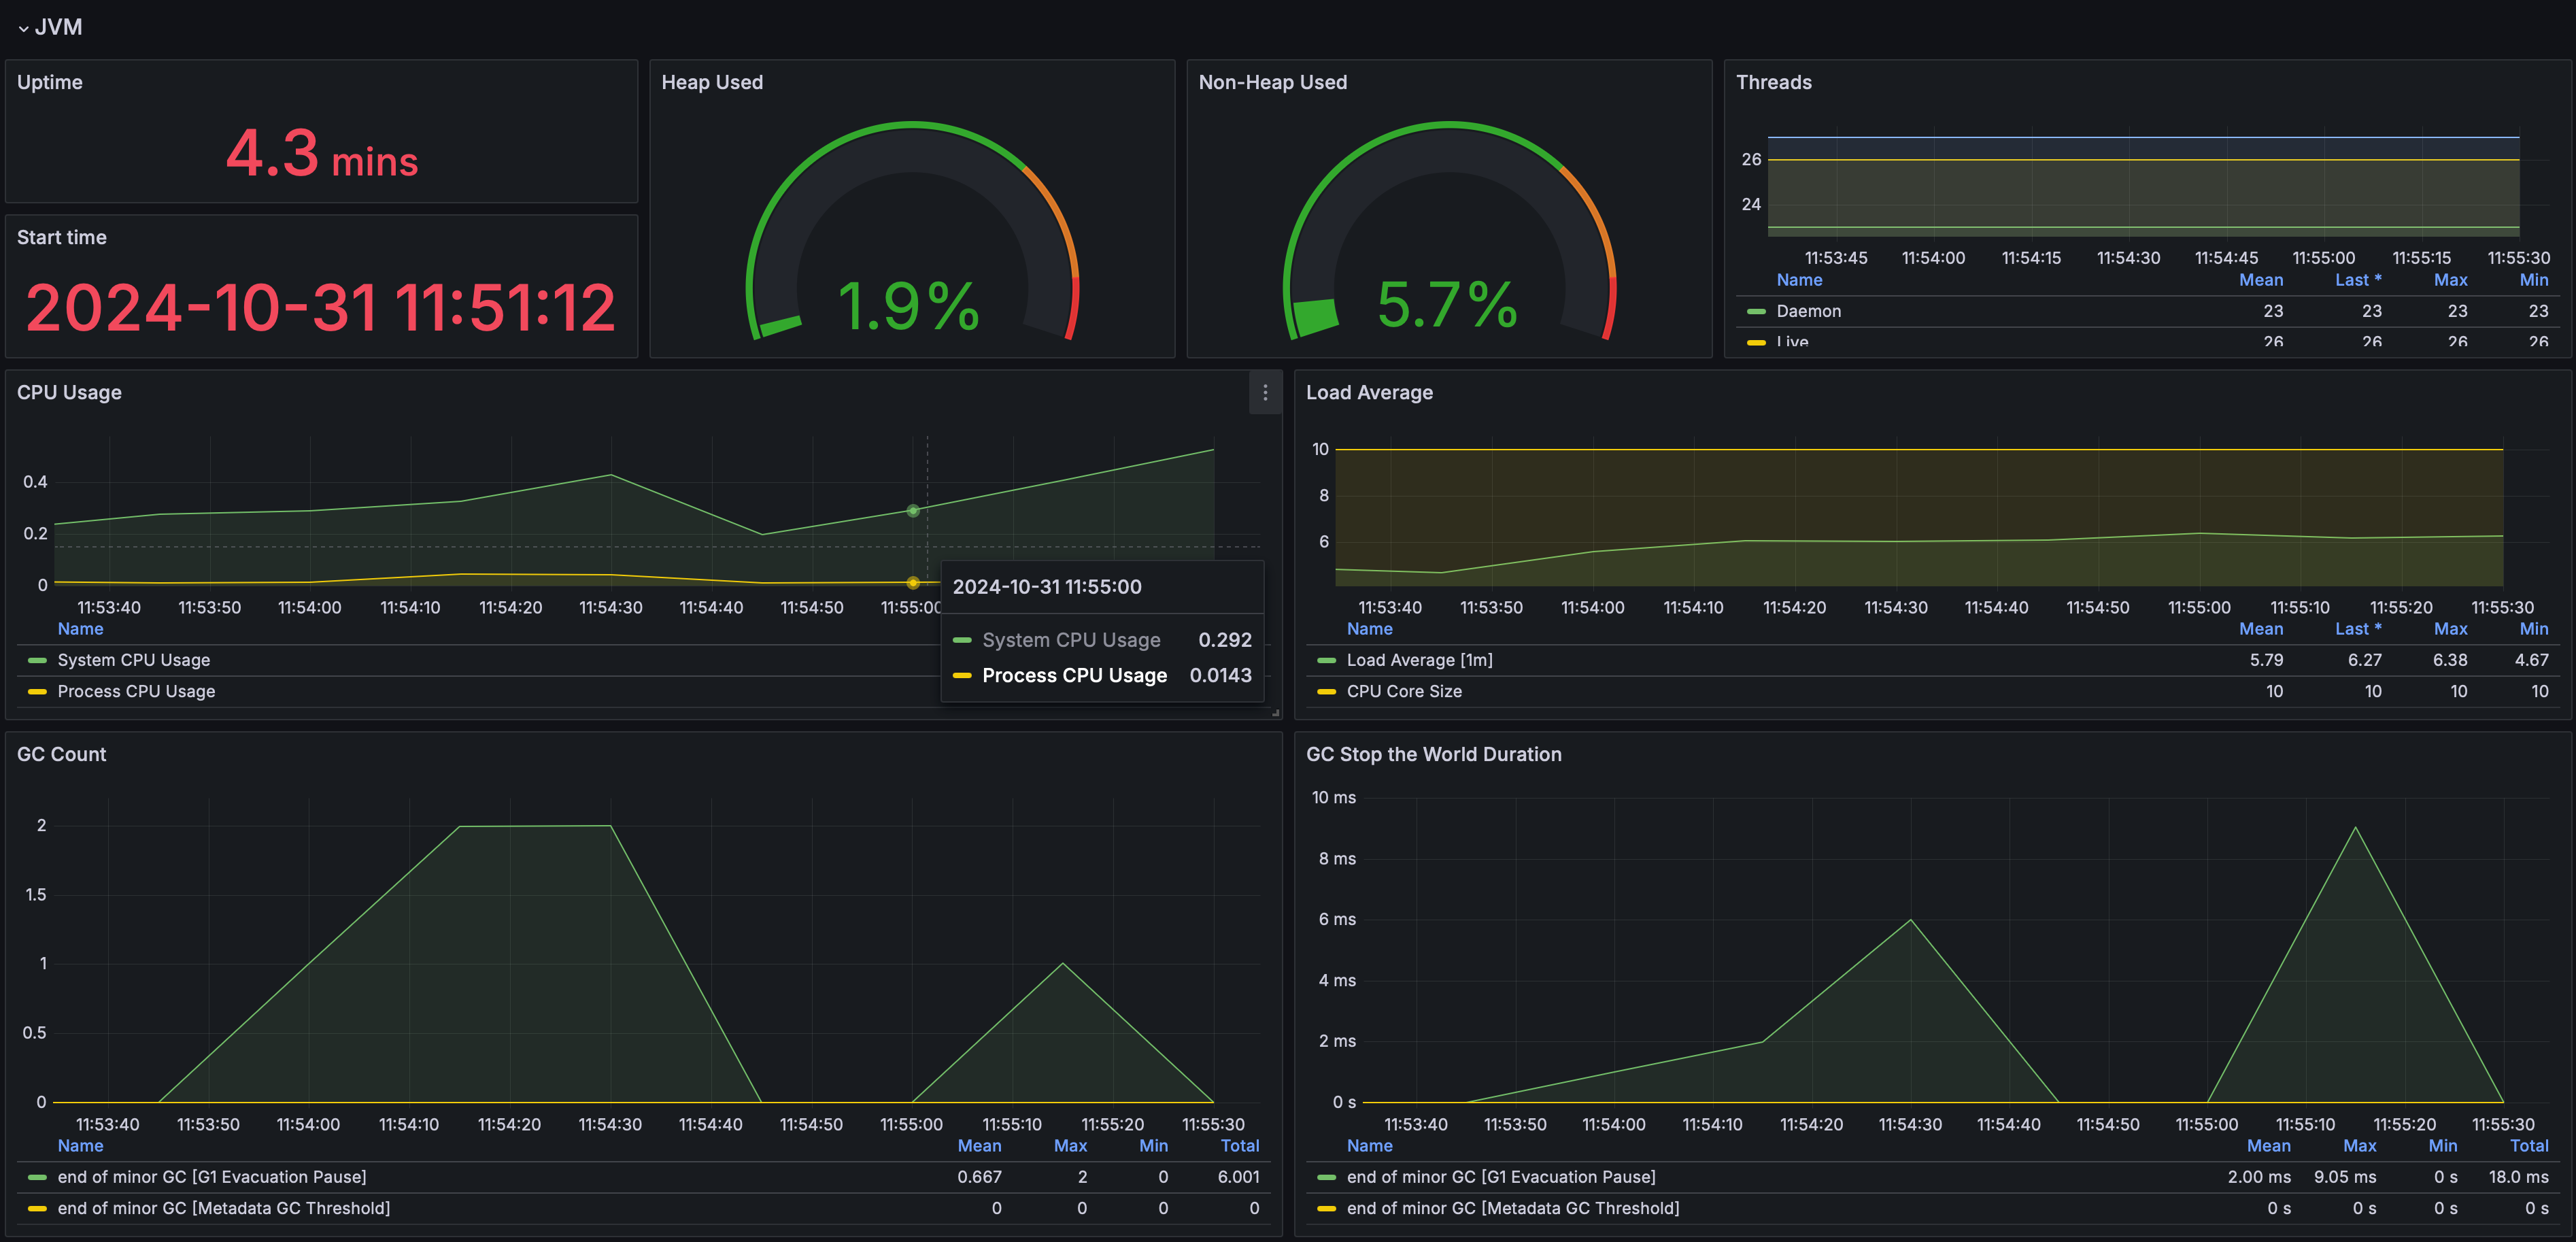
JVM Metrics
Use the --metrics-jvm option to enable the following additional metrics:
| Name | Type | Description |
|---|---|---|
|
Gauge |
An estimate of the number of buffers in the pool |
|
Gauge |
An estimate of the memory that the Java virtual machine is using for this buffer pool |
|
Gauge |
An estimate of the total capacity of the buffers in this pool |
|
Timer |
Time spent in concurrent phase |
|
Gauge |
Size of long-lived heap memory pool after reclamation |
|
Gauge |
Max size of long-lived heap memory pool |
|
Gauge |
Incremented for an increase in the size of the (young) heap memory pool after one GC to before the next |
|
Counter |
Count of positive increases in the size of the old generation memory pool before GC to after GC |
|
Timer |
Time spent in GC pause |
|
Gauge |
The amount of memory in bytes that is committed for the Java virtual machine to use |
|
Gauge |
The maximum amount of memory in bytes that can be used for memory management |
|
Gauge |
The amount of used memory |
|
Gauge |
The current number of live daemon threads |
|
Gauge |
The current number of live threads including both daemon and non-daemon threads |
|
Gauge |
The peak live thread count since the Java virtual machine started or peak was reset |
|
Counter |
The total number of application threads started in the JVM |
|
Gauge |
The current number of threads |
|
Counter |
The "cpu time" used by the Java Virtual Machine process |
|
Gauge |
The "recent cpu usage" for the Java Virtual Machine process |
|
Gauge |
Start time of the process since unix epoch. |
|
Gauge |
The uptime of the Java virtual machine |
|
Gauge |
The number of processors available to the Java virtual machine |
|
Gauge |
The "recent cpu usage" of the system the application is running in |
|
Gauge |
The sum of the number of runnable entities queued to available processors and the number of runnable entities running on the available processors averaged over a period of time |
Telegraf
RIOT-X logs can be collected and analyzed using Telegraf, an open-source server agent for collecting and sending metrics and logs.
Log Format
RIOT-X uses SLF4J Simple Logger with a configurable format.
Default format:
yyyy-MM-dd HH:mm:ss.SSS [LEVEL] logger.name - messageExample output:
2024-12-02 10:15:30.123 [INFO] com.redis.riot.FileImportCommand - Starting file import
2024-12-02 10:15:31.456 [WARN] com.redis.riot.ProgressStepExecutionListener - Slow processing detected
2024-12-02 10:15:32.789 [ERROR] com.redis.riot.ReplicateCommand - Connection failed
When --log-thread is enabled, the format includes thread information:
2024-12-02 10:15:30.123 [INFO] [main] com.redis.riot.FileImportCommand - Starting file importLogging Options
Configure logging behavior with these options:
--log-file <file>-
Write logs to a file
--log-level <level>-
Set log level: ERROR, WARN, INFO, DEBUG, or TRACE (default: WARN)
--log-time-fmt <format>-
Date/time format (default:
yyyy-MM-dd HH:mm:ss.SSS) --no-log-time-
Hide timestamp in log messages
--log-thread-
Show thread name in log messages
--log-name-
Show logger instance name
-d, --debug-
Enable debug logging
-i, --info-
Enable info logging
-q, --quiet-
Show errors only
Telegraf Setup
-
Configure RIOT-X to write logs to a file:
riotx --log-file /var/log/riotx/riotx.log file-import data.csv -
Download the complete Telegraf configuration: ../_attachments/telegraf-riotx.conf[telegraf-riotx.conf]
-
Create a Telegraf configuration file (
/etc/telegraf/telegraf.d/riotx.conf) with the following minimal setup:[[inputs.tail]] files = ["/var/log/riotx/*.log"] from_beginning = false data_format = "grok" grok_patterns = [ '%{TIMESTAMP_ISO8601:timestamp} \[%{LOGLEVEL:level}\] \[%{DATA:thread}\] %{DATA:logger} - %{GREEDYDATA:message}', '%{TIMESTAMP_ISO8601:timestamp} \[%{LOGLEVEL:level}\] %{DATA:logger} - %{GREEDYDATA:message}', ] name_override = "riotx_logs" grok_timezone = "Local" [[processors.date]] field = "timestamp" field_key = "timestamp" date_format = ["2006-01-02 15:04:05.000"] [[processors.enum]] [[processors.enum.mapping]] field = "level" dest = "severity" [processors.enum.mapping.value_mappings] TRACE = 1 DEBUG = 2 INFO = 3 WARN = 4 ERROR = 5 [[outputs.influxdb_v2]] urls = ["http://localhost:8086"] token = "$INFLUX_TOKEN" organization = "myorg" bucket = "riotx_logs" -
Start Telegraf:
sudo systemctl restart telegraf
Parsed Fields
The Telegraf configuration extracts these fields:
| Field | Type | Description |
|---|---|---|
|
timestamp |
Log entry timestamp |
|
string |
Log level (TRACE, DEBUG, INFO, WARN, ERROR) |
|
integer |
Numeric severity (1-5) |
|
string |
Full logger name |
|
string |
Thread name (if enabled) |
|
string |
Log message content |
Docker Deployment
For containerized deployments, use the Docker log input:
[[inputs.docker_log]]
  endpoint = "unix:///var/run/docker.sock"
  container_name_include = ["riotx*"]
  data_format = "grok"
  grok_patterns = [
    '%{TIMESTAMP_ISO8601:timestamp} \[%{LOGLEVEL:level}\] %{DATA:logger} - %{GREEDYDATA:message}',
  ]
  name_override = "riotx_logs"
Querying Logs
Example InfluxDB Flux queries:
Get ERROR level logs:
from(bucket: "riotx_logs")
  |> range(start: -1h)
  |> filter(fn: (r) => r._measurement == "riotx_logs")
  |> filter(fn: (r) => r.level == "ERROR")
Count logs by level:
from(bucket: "riotx_logs")
  |> range(start: -24h)
  |> filter(fn: (r) => r._measurement == "riotx_logs")
  |> group(columns: ["level"])
  |> count()
For a complete setup guide including Docker, Kubernetes, Elasticsearch, and Prometheus configurations, see ../_attachments/TELEGRAF_SETUP.adoc[Telegraf Setup Guide].

