|
This version is still in development and is not considered stable yet. For the latest stable version, please use RIOT-X 2.0! |
Observability
RIOT-X exposes several metrics over a Prometheus endpoint that can be useful for troubleshooting and performance tuning.
Getting Started
The riotx-dist repository includes a Docker compose configuration that set ups Prometheus and Grafana.
git clone https://github.com/redis/riotx-dist.git
cd riotx-dist
docker compose up
Prometheus is configured to scrape the host every second.
You can access the Grafana dashboard at localhost:3000.
Now start RIOT-X with the following command:
riotx replicate ... --metricsThis will enable the Prometheus metrics exporter endpoint and will populate the Grafana dashboard.
Configuration
Use the --metrics* options to enable and configure metrics:
--metrics-
Enable metrics
--metrics-jvm-
Enable JVM and system metrics
--metrics-redis-
Enable command latency metrics. See https://github.com/redis/lettuce/wiki/Command-Latency-Metrics#micrometer
--metrics-name=<name>-
Application name tag that will be applied to all metrics
--metrics-port=<int>-
Port that Prometheus HTTP server should listen on (default:
8080) --metrics-prop=<k=v>-
Additional properties to pass to the Prometheus client. See https://prometheus.github.io/client_java/config/config/
Metrics
Below you can find a list of all metrics declared by RIOT-X.
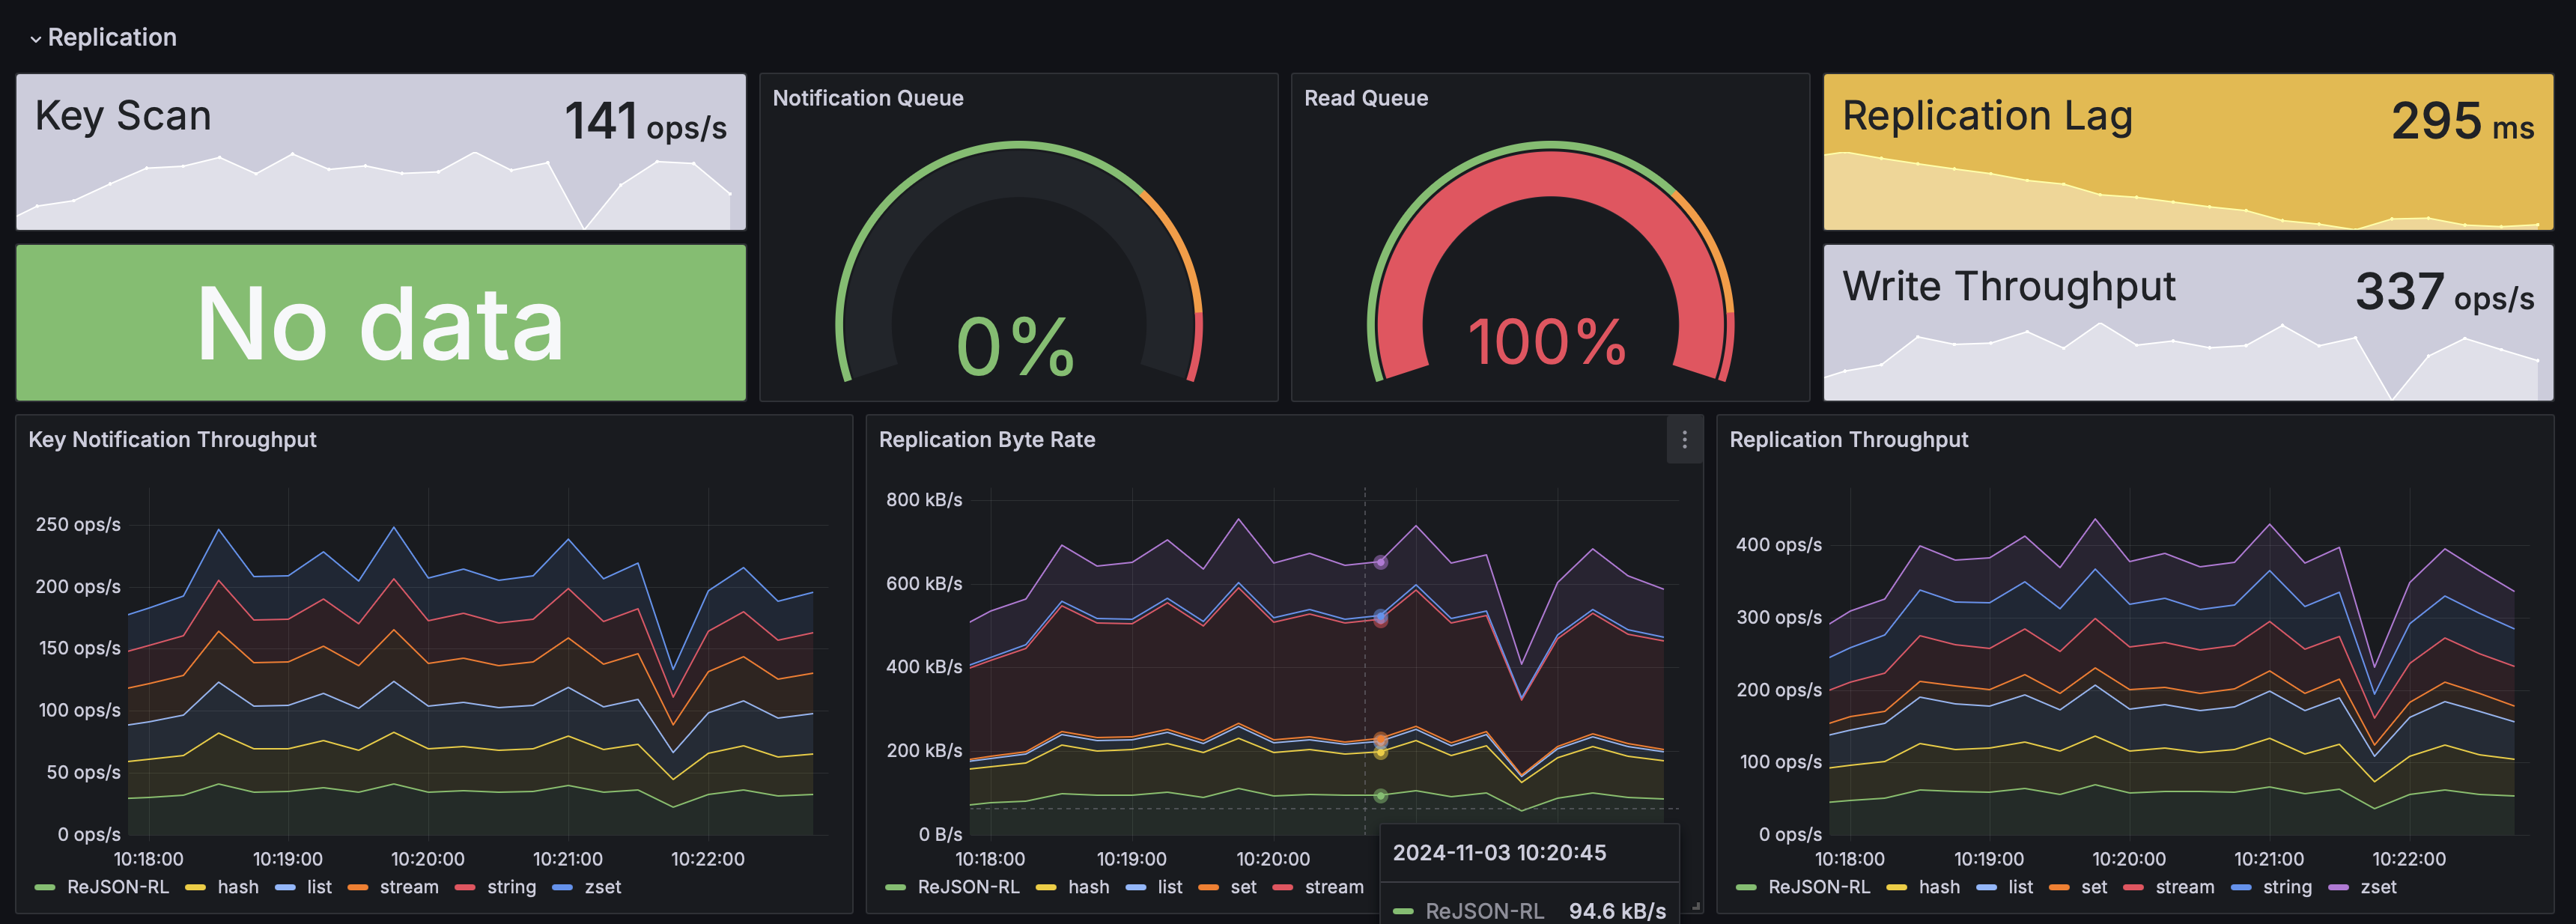
Replication Metrics
| Name | Type | Description |
|---|---|---|
|
Counter |
Number of bytes replicated (needs memory usage with |
|
Summary |
Replication end-to-end latency |
|
Summary |
Replication read latency |
|
Timer |
Batch writing duration |
|
Timer |
Item processing duration |
|
Timer |
Item reading duration |
|
Timer |
Active jobs |
|
Counter |
Job launch count |
|
Gauge |
Remaining capacity of the keyspace notification queue |
|
Gauge |
Number of keyspace notifications waiting in the queue |
|
Counter |
Keyspace notifications received, by |
|
Timer |
Duration of each batch of Redis commands, by |
CDC Metrics
snowflake-import reports the state of each captured table when writing change records to Redis streams.
All metrics carry the labels connector, source (the --source-name value) and table (the fully qualified table name).
To get values for the whole source, aggregate over the tables in your query, e.g. max by (source) (riot_cdc_source_lag_seconds).
The metrics exist only while snowflake-import runs, and a failed table ends it.
Each restart sets riot_cdc_source_lag_seconds back to 0 and riot_cdc_source_last_probe_age_seconds to the time since the restart, so the metrics do not show an import that keeps failing.
See Snowflake Monitoring for how to detect it.
| Name | Type | Description |
|---|---|---|
|
Gauge |
|
|
Gauge |
|
|
Gauge |
Seconds since the table was last read from Snowflake: a successful check for changes, a fetch of changes, or a row of the snapshot or of a batch of changes. Before the first read, it is the time since the import started. The table is checked every |
|
Gauge |
Upper bound on how far Redis is behind the Snowflake table; |
|
Counter |
Change records read from Snowflake, by operation ( |
|
Gauge |
Seconds since the last change record was read from Snowflake; |
|
Counter |
Change records skipped because they could not be processed or written (see |
|
Counter |
Failed operations, by stage ( |
|
Counter |
Write attempts rejected because the target stream is longer than |
|
Timer |
Time to prepare a batch of changes in Snowflake and start reading it, including waiting for a connection from the pool, by |
|
Gauge |
|
|
Gauge |
|
|
Gauge |
|
|
Gauge |
|
|
Counter |
Rows of the initial snapshot read from Snowflake |
|
Gauge |
Rows in the initial snapshot; |
|
Gauge |
Duration of the running, completed or aborted initial snapshot, from its start, including creating the Snowflake stream, until its offset is saved; |
snowflake-import also reports the health of its Snowflake connection pool with the standard HikariCP metrics, labeled pool="snowflake" by default.
The most useful ones are listed below.
| Name | Type | Description |
|---|---|---|
|
Gauge |
Connections in use |
|
Gauge |
Open connections not in use |
|
Gauge |
Threads waiting for a connection |
|
Gauge |
Maximum pool size ( |
|
Counter |
Requests that timed out waiting for a connection |
|
Timer |
Time to obtain a connection from the pool |
JVM Metrics
Use the --metrics-jvm option to enable the following additional metrics:
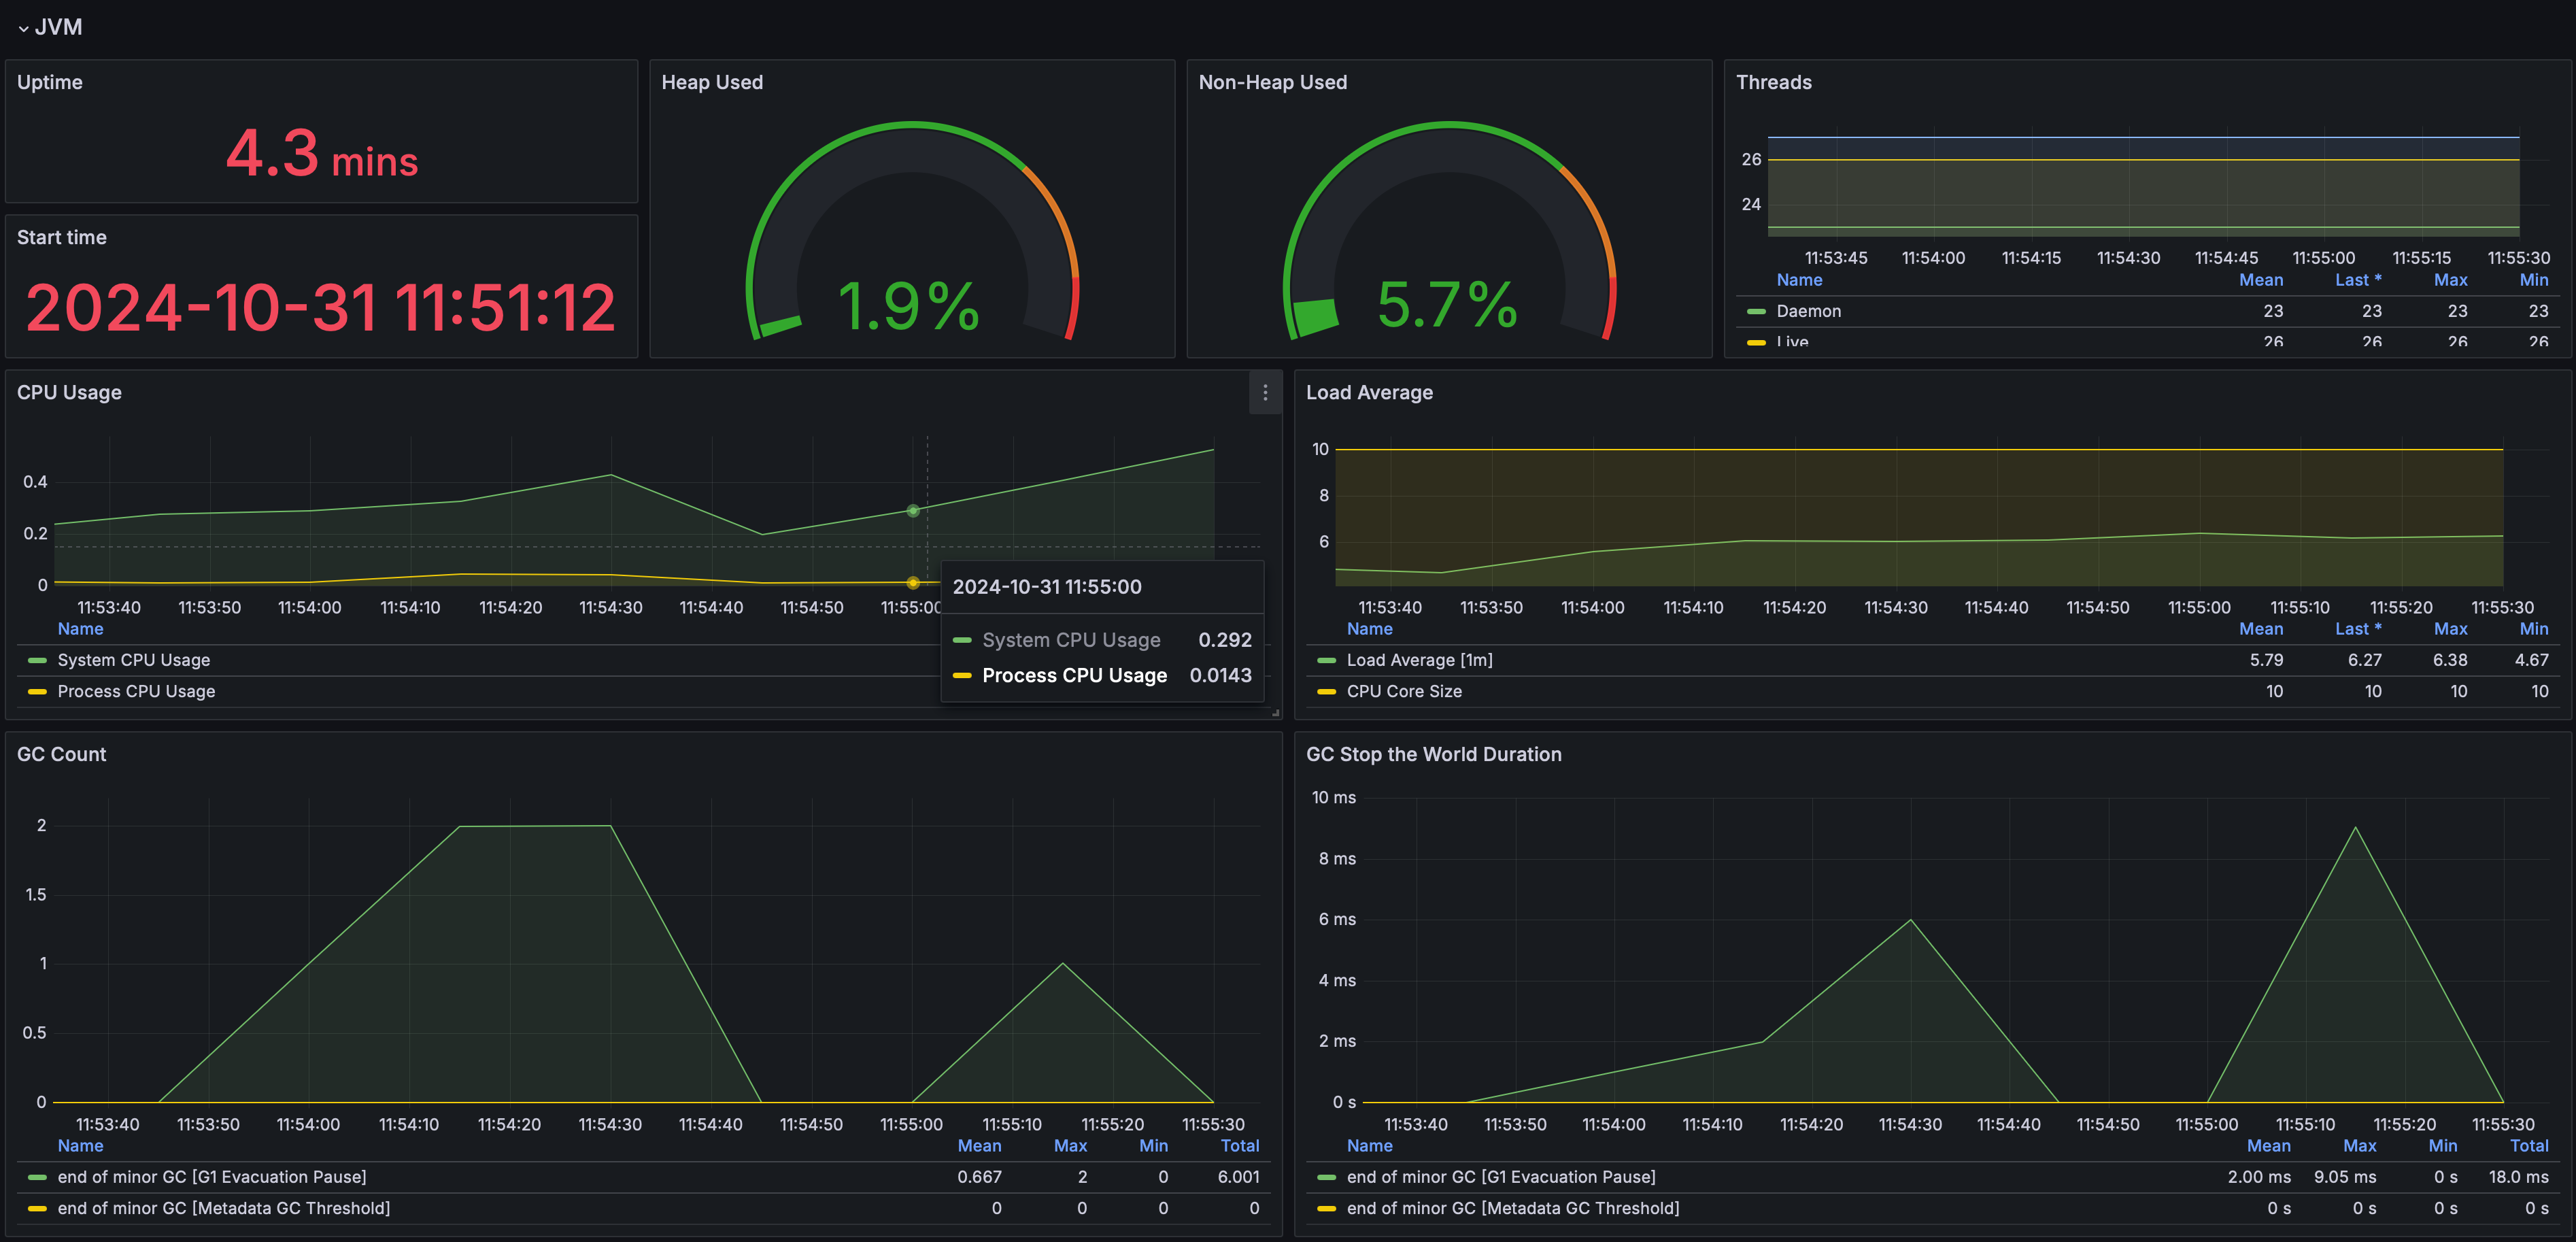
| Name | Type | Description |
|---|---|---|
|
Gauge |
An estimate of the number of buffers in the pool |
|
Gauge |
An estimate of the memory that the Java virtual machine is using for this buffer pool |
|
Gauge |
An estimate of the total capacity of the buffers in this pool |
|
Timer |
Time spent in concurrent phase |
|
Gauge |
Size of long-lived heap memory pool after reclamation |
|
Gauge |
Max size of long-lived heap memory pool |
|
Gauge |
Incremented for an increase in the size of the (young) heap memory pool after one GC to before the next |
|
Counter |
Count of positive increases in the size of the old generation memory pool before GC to after GC |
|
Timer |
Time spent in GC pause |
|
Gauge |
The amount of memory in bytes that is committed for the Java virtual machine to use |
|
Gauge |
The maximum amount of memory in bytes that can be used for memory management |
|
Gauge |
The amount of used memory |
|
Gauge |
The current number of live daemon threads |
|
Gauge |
The current number of live threads including both daemon and non-daemon threads |
|
Gauge |
The peak live thread count since the Java virtual machine started or peak was reset |
|
Counter |
The total number of application threads started in the JVM |
|
Gauge |
The current number of threads |
|
Counter |
The "cpu time" used by the Java Virtual Machine process |
|
Gauge |
The "recent cpu usage" for the Java Virtual Machine process |
|
Gauge |
Start time of the process since unix epoch. |
|
Gauge |
The uptime of the Java virtual machine |
|
Gauge |
The number of processors available to the Java virtual machine |
|
Gauge |
The "recent cpu usage" of the system the application is running in |
|
Gauge |
The sum of the number of runnable entities queued to available processors and the number of runnable entities running on the available processors averaged over a period of time |
Telegraf
RIOT-X logs can be collected and analyzed using Telegraf, an open-source server agent for collecting and sending metrics and logs.
Log Format
RIOT-X uses SLF4J Simple Logger with a configurable format.
Default format:
yyyy-MM-dd HH:mm:ss.SSS [LEVEL] logger.name - messageExample output:
2024-12-02 10:15:30.123 [INFO] com.redis.riot.FileImportCommand - Starting file import
2024-12-02 10:15:31.456 [WARN] com.redis.riot.ProgressStepExecutionListener - Slow processing detected
2024-12-02 10:15:32.789 [ERROR] com.redis.riot.ReplicateCommand - Connection failed
When --log-thread is enabled, the format includes thread information:
2024-12-02 10:15:30.123 [INFO] [main] com.redis.riot.FileImportCommand - Starting file importLogging Options
Configure logging behavior with these options:
--log-file <file>-
Write logs to a file
--termination-log <file>-
Also write ERROR messages and fatal command exceptions to a termination message file. Disabled by default. Existing console and file logging is preserved.
--log-level <level>-
Set log level: ERROR, WARN, INFO, DEBUG, or TRACE (default: WARN)
--log-time-fmt <format>-
Date/time format (default:
yyyy-MM-dd HH:mm:ss.SSS) --no-log-time-
Hide timestamp in log messages
--log-thread-
Show thread name in log messages
--log-name-
Show logger instance name
-d, --debug-
Enable debug logging
-i, --info-
Enable info logging
-q, --quiet-
Show errors only
For Kubernetes collectors, use --termination-log=/dev/termination-log. The file is cleared before command execution and immediately updated with the latest error and its exception causes, without timestamps, stack traces, or ANSI colors. Messages are limited to 4096 UTF-8 bytes. File errors are reported to stderr without changing the command exit code.
Telegraf Setup
-
Configure RIOT-X to write logs to a file:
riotx --log-file /var/log/riotx/riotx.log file-import data.csv -
Download the complete Telegraf configuration: ../_attachments/telegraf-riotx.conf[telegraf-riotx.conf]
-
Create a Telegraf configuration file (
/etc/telegraf/telegraf.d/riotx.conf) with the following minimal setup:[[inputs.tail]] files = ["/var/log/riotx/*.log"] from_beginning = false data_format = "grok" grok_patterns = [ '%{TIMESTAMP_ISO8601:timestamp} \[%{LOGLEVEL:level}\] \[%{DATA:thread}\] %{DATA:logger} - %{GREEDYDATA:message}', '%{TIMESTAMP_ISO8601:timestamp} \[%{LOGLEVEL:level}\] %{DATA:logger} - %{GREEDYDATA:message}', ] name_override = "riotx_logs" grok_timezone = "Local" [[processors.date]] field = "timestamp" field_key = "timestamp" date_format = ["2006-01-02 15:04:05.000"] [[processors.enum]] [[processors.enum.mapping]] field = "level" dest = "severity" [processors.enum.mapping.value_mappings] TRACE = 1 DEBUG = 2 INFO = 3 WARN = 4 ERROR = 5 [[outputs.influxdb_v2]] urls = ["http://localhost:8086"] token = "$INFLUX_TOKEN" organization = "myorg" bucket = "riotx_logs" -
Start Telegraf:
sudo systemctl restart telegraf
Parsed Fields
The Telegraf configuration extracts these fields:
| Field | Type | Description |
|---|---|---|
|
timestamp |
Log entry timestamp |
|
string |
Log level (TRACE, DEBUG, INFO, WARN, ERROR) |
|
integer |
Numeric severity (1-5) |
|
string |
Full logger name |
|
string |
Thread name (if enabled) |
|
string |
Log message content |
Docker Deployment
For containerized deployments, use the Docker log input:
[[inputs.docker_log]]
  endpoint = "unix:///var/run/docker.sock"
  container_name_include = ["riotx*"]
  data_format = "grok"
  grok_patterns = [
    '%{TIMESTAMP_ISO8601:timestamp} \[%{LOGLEVEL:level}\] %{DATA:logger} - %{GREEDYDATA:message}',
  ]
  name_override = "riotx_logs"
Querying Logs
Example InfluxDB Flux queries:
Get ERROR level logs:
from(bucket: "riotx_logs")
  |> range(start: -1h)
  |> filter(fn: (r) => r._measurement == "riotx_logs")
  |> filter(fn: (r) => r.level == "ERROR")
Count logs by level:
from(bucket: "riotx_logs")
  |> range(start: -24h)
  |> filter(fn: (r) => r._measurement == "riotx_logs")
  |> group(columns: ["level"])
  |> count()
For a complete setup guide including Docker, Kubernetes, Elasticsearch, and Prometheus configurations, see ../_attachments/TELEGRAF_SETUP.adoc[Telegraf Setup Guide].

